
- #Hopper disassembler tutorial cracked#
- #Hopper disassembler tutorial Patch#
- #Hopper disassembler tutorial code#

You should see in the top bar ‘Preparing debugger support for iPhone…’. With your device connected via USB, try to build/run the app on your device.Open up XCode, and create a new project.Then check if the ‘debugserver’ binary file exists. To check, ssh in and go to ‘Developer/usr/bin’. To setup lldb, you’ll first want to check if you have ‘debugserver’ installed on your phone. But, there are times where it won’t be so clear what’s going on, and stepping through the execution with lldb can help you understand how it works.


Sometimes, what’s going on in a method seems pretty obvious, usually by the name of the method and its return value type (viewed in the dumped headers), or by skimming through its assembly code. ‘lldb’ is a debugger that is similar to gdb, although commands differ. Getting in depth on ARM would simply not fit into this post, so I will refer you to this great tutorial here by Azeria-Labs ( ) if you’re interested in learning more about it. For those with a formal computer science education, you probably have seen either MIPS or x86 assembly in school before – if you’re familiar with either of these, ARM shouldn’t be too hard to get a hang of. For iOS apps, the assembly we see is ARM assembly. Obviously, it’s a lot harder to read and write than a standard programming language.
#Hopper disassembler tutorial code#
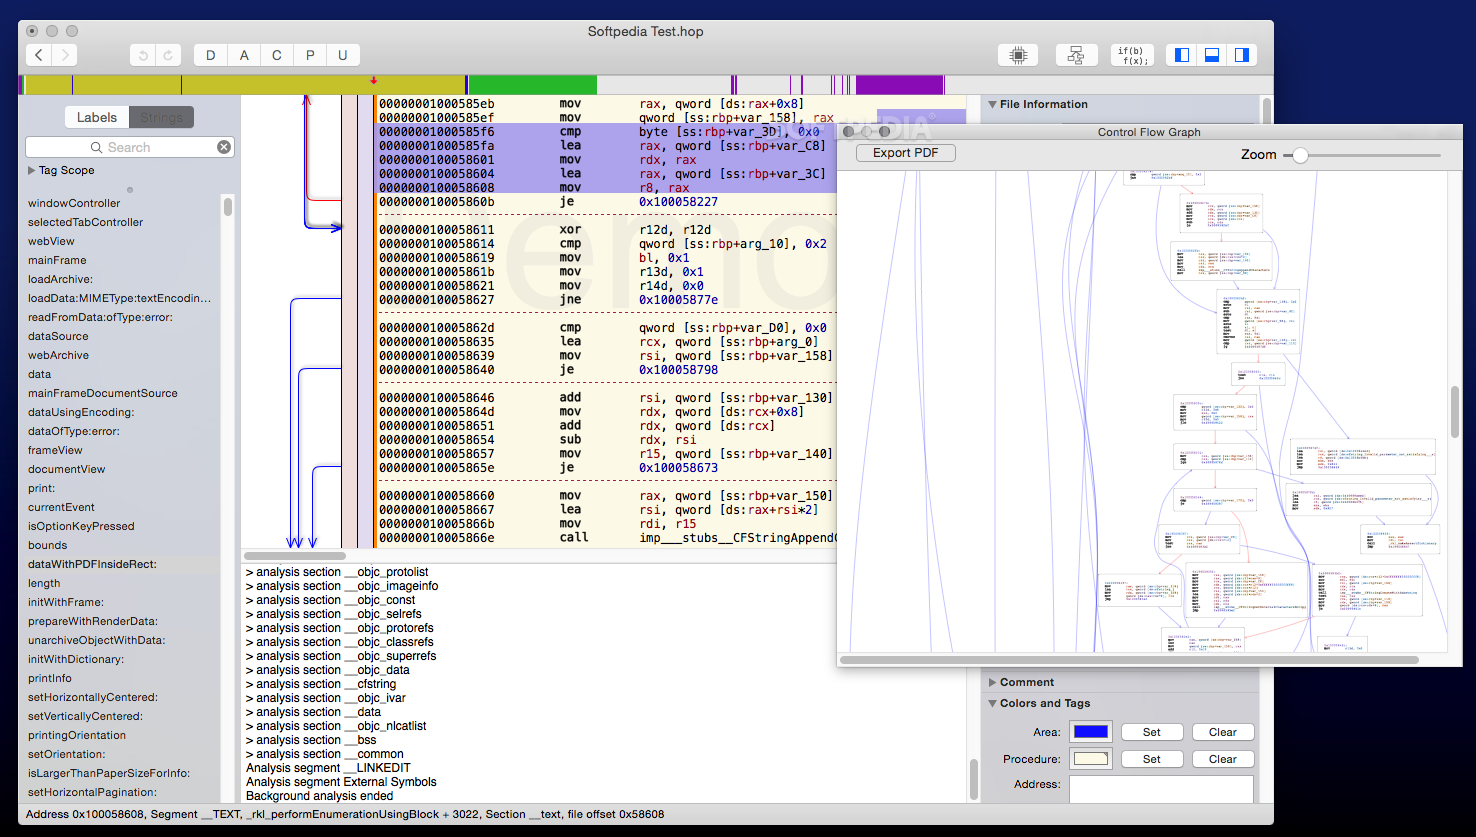
For those who are new to assembly, assembly code is essentially an intermediate format of code – it’s what the code you wrote in your language of choice gets converted into when compiled. Now, if you’ve never worked with assembly code before you will probably be very confused with what you’re seeing. > Analysis pass 10/10: searching contiguous code area > Analysis pass 9/10: remaining prologs search > dataflow analysis of procedures in segment External Symbols > dataflow analysis of procedures in segment _LINKEDIT When disassembly is complete, you should see this at the bottom of the Hopper window: > dataflow analysis of procedures in segment _DATA Now, we will have to wait for Hopper to do its thing – disassembly can often take a while, and the time depends on the size of the app and your computer’s specs. The binary will simply be called ‘AppName’ with no file extension. Remember that the app’s binary is located inside the file we downloaded from our device, in Payload/AppName.app. Now we can open Hopper, go to File -> Read Executable To Disassemble and select the app binary. In Part 1, we decrypted an app with bfinject and downloaded the. Once you’ve installed Hopper, we are ready to begin analyzing our chosen target app.
#Hopper disassembler tutorial Patch#
The free version will do just fine for our purposes – with pro you will gain features allowing you to patch binaries, but it isn’t necessary for basic analysis and debugging.
#Hopper disassembler tutorial cracked#
Hopper is a decompiler and disassembler that will allow us to view the assembly code of a cracked app’s binary. In this tutorial we’ll be using Hopper Disassembler. I am specifically using iOS 11.1.2, but most of the tools in the series should work on any version of iOS 11. The series will be assuming that the user is using Electra jailbreak. I want to note that I won’t be going in depth into ARM and assembly code in general, as it simply would not fit into this post – however, I will refer you to other sources to learn about it. We will start with an introduction to binary analysis with ‘Hopper’, then we will move into debugging app store apps using ‘lldb’. This post is the 4th and final part a series giving an overview of the most useful iOS app pentesting tools.


 0 kommentar(er)
